|
www.business-exploration.com - P.I. 05998900483 - © 2011 - all rights reserved Contacts: (+39) 349 648 2225 - info@ingtosi.it - Offices: via 8 Marzo, 22 - 50051 - Castelfiorentino - ( Firenze ) - Italy Business Exploration is an Associate Partner of IMC International - Switzerland. “ Volemose bene, damose da fa! - JPII “ |
|
If your organization’s processes don’t follow, I take care of all necessary process improvements, end-to-end, while you target new Customers. I don’t mould you into a pre-designed software. I know by experience that this seldom works, does not last and forces your company to use the same processes of your Competitors. Instead, I use my experience of the Oil & Gas equipment business, to listen to your needs and craft with you the next level of competitive edge. I have developed a complete route that assesses your process performances, redesigns it according to your goals, sustains it with workflows and deploys the new process into your organization using change management and Six Sigma methodologies. I sustain the new process with upgrades and updates, managing all hardware interfaces, providing tailored dashboards and reports that steer your organization to the new business targets .
In this page you find some of our best practices, and is continuously updated. If You want to be alerted for new publication sign-up my mailing list. I will send you as welcome, my free white paper: “six sigma for staff functions”.
|
|
Process innovation essentials: |
|
The 8 resistances - and their Tuscan translation |
|
The 8 Resistances - and their Tuscan translation
It’s the human nature. Whenever you propose something NEW, you will encounter strong Resistances. The people who will embrace your new idea in the beginning, are usually less then 2% of the population. The others will do so only when they could not do otherwise: or because in an emergency, or because their comfort zone is already in ruins. And expect that a 2% will fight the new idea with all what in its power. This is the reason why I start this section with the list of the Resistances. If You know what you will encounter, you may prepare to convince your target population faster.
1. Poor understanding of the value added: ( ma icchè me ne fo?) 2. Is not the way we do things, here: ( belle le chartine, perchè ‘un vieni a lavora’?) 3. Fearing the un-known: ( ma ‘un c’è mai stato problemi… si va proprio bene come s’è fatto finora) 4. Lack of training and reference points: (e ‘un ci s’ha il tempo per guardare queste cose ) 5. Previous failures: ( n’ho visti tanti …) 6. Not invented here: ( eh funzionerà all’ IPSTRIM, ma qui…) 7. Fearing loss of privileges: ( Thessoro… voglio il mio thessoro… ) 8. Lack of control: ( Ma tanto ‘un li guarda nessuno…) |

|
Get: “six sigma for staff function”: |
|
Process Maturity - free test! |
|
Quality History - for Dummies |
|
Process Maturity - Test
How much: Your organization’s Processes can sustain Your Business Strategy?
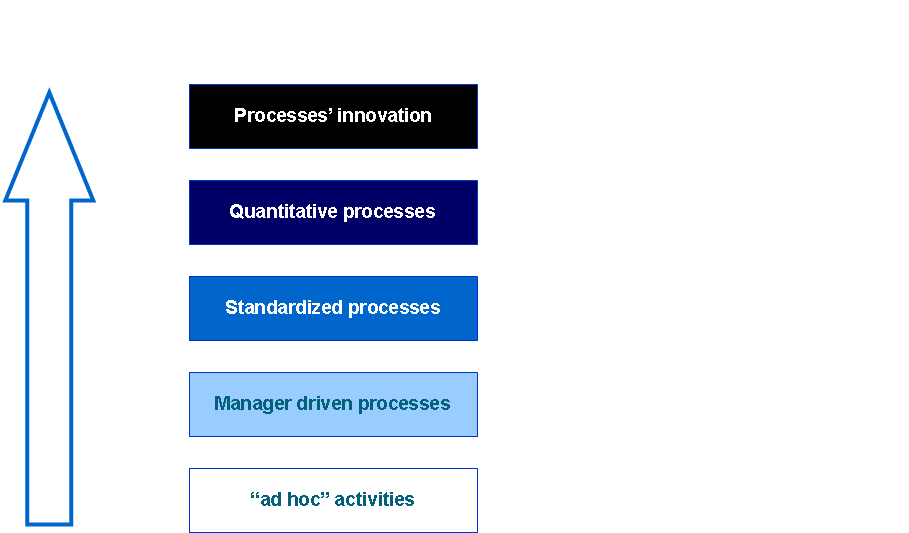
Like human beings, organizations grow and reach higher level of capabilities. It is important to understand the level of maturity of Your organization, if You want to be sure it can follow You on your market exploration. The higher the Maturity, the more Your processes can deliver what market requests, efficiently, predictably, being able to manage exceptions and to respond to changed Customer needs.
The BPMM - Business Process Maturity Model - is a framework that compare Your organization to a standard, measuring it in a scale of 5 Maturity levels. The first rules that applies is that very seldom You may upgrade Your organization capability avoiding to pass through all the intermediate levels. If You want to understand Your organization maturity, You may answer this simple questions and ask me for a personal feedback:
|
|
Quality History - for Dummies
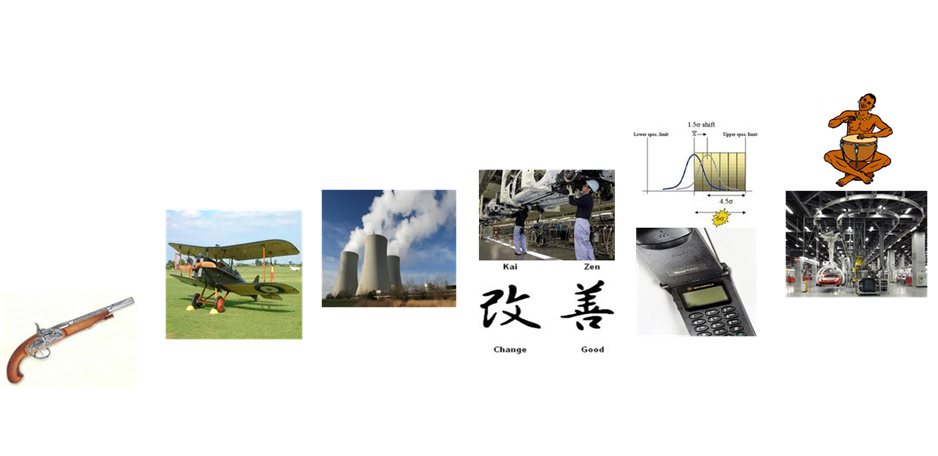
Quality has not come overnight. Is one of the last century invention. I think that understanding the historical context where some of its features born, is much useful to understand the roots of the underpinning concept. So here is my personal summary of Quality’s history:
|
|
Project Control’s KPI - a different approach |
|
Project’s control KPI - a different approach
As a Black Belt looking for ways to keep under control a Project and a Portfolio of projects, I have developed metrics and dashboards that simplified making the status and the outlook of a project, respected the planned dates. The Dashboards here described are not rocket science. BUT they look at COMPLETION from a different perspective respect the classic Gannt or “S” Curves. When You are in the tunnel of the Project, You do not care about how much of the tunnel is behind: you just look to the finish line: Time to destination. In the same way, if you partner with a Customer to create the engineered solution, and you are exchanging documents to achieve progressive refinement of the concept, you really do not care of how many revision you go through before the Final Issue, but Who has the ball? What is important is that each party add his information without stopping the document going back to the other party. A delay in revising the document means a delay in getting the next piece of information and therefore slowing the project itself. These dashboards can be used to create on-shot screen pictures of the Project status, historical summaries of the project efforts, operate dramatic drill downs by project phase, Project team, Suppliers Support, and help discover major disruptions well in advance. Furthermore are a powerful tool to communicate internally and externally in an open and fair manner the project progress, helping Project Managers, Customers, Partners and Team members be on the same page and drive towards a common goal. This is a summary of the original article issued in 2006 on “Impiantistica italiana”, the official Italian EPC Companies association magazine (ANIMP).
|
|
Back to list |
|
Back to Top |
|
Back to list |
|
Back to Top |
|
Back to list |
|
Back to Top |
|
Back to list |
|
Back to Top |
|
Back to list |
|
Back to Top |
|
Selling a Change to your team? |
|
I can help, with advanced methodologies: Change Management Facilitator - certified by GE Six Sigma Black Belt - DMAIC, DFSS, LEAN Project Manager - certified by IAFE - School of ENI Root Cause Analysis specialist - APOLLO method Adult Teaching specialist - ACHIEVE methodology
|
|
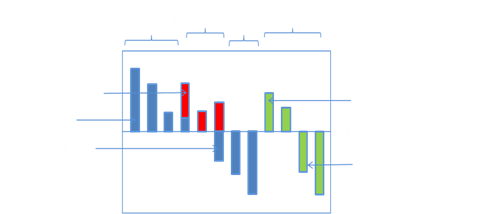
This powerful graph introduces a different perspective, looking only to “time to destination”, without showing time elapsed. It is particularly indicated to keep under control main project items. Divides the items in 4 clear baskets: - “Out of control” : items not completed, are in delay , and do not show a re-planned date - “In delay”: items not completed, replanned, there could be time to recover (*) - “On time”: items not completed, not replanned, not in delay - “Completed”: items completed, in delay, on time , even before target. |
|
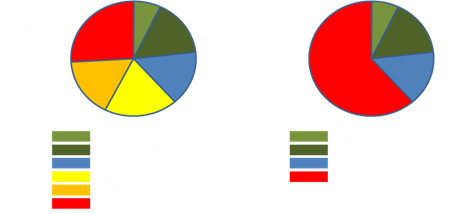
KPI: “time to destination” |
|
KPI: “completeness” |
|
You can summarize the information in full (Sx) or with less details (Dx) It is particularly indicated to keep under control main project items. Divides the items in 6 or 4 clear baskets: - “Out of control” : items not completed, are in delay , and do not show a re-planned date - “In delay”: items not completed, replanned, there could be time to recover (*) - “On time”: items not completed, not replanned, not in delay - “Completed”: items completed, in delay, on time , even before target. |
|
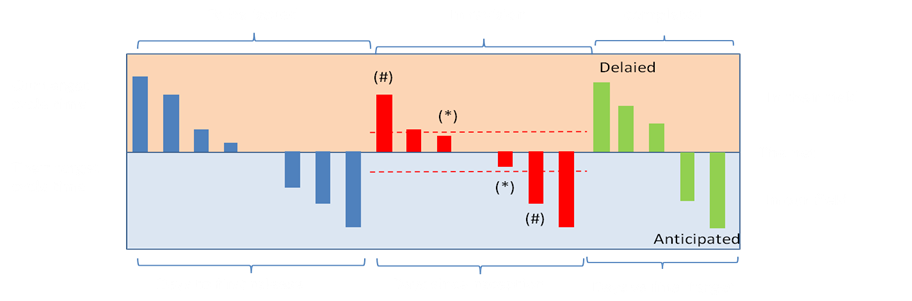
This powerful graph introduces a different perspective, looking only to “who has the ball”, without considering how many times the ball crossed the net. It is particularly indicated to keep under control Customer Drawings that needs several revisions before approval. Divides the items in 8 clear baskets: |

|
- “to be issued” – in delay -“ to be issued” – on time -“in their hand” – in delay (#) or on time (*) -“in our hand” – in delay (#) or on time (*) -“finalized” – in delay -“finalized” – on time |
|
KPI: “where is the ball?” ” |

|
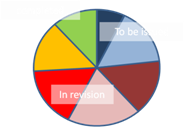
You can summarize the information Dividing the items in 8 clear baskets: - “to be issued” – in delay -“ to be issued” – on time -“in their hand” – in delay -“in their hand” - on time -“in our hand” – in delay - “in our hand” - on time -“finalized” – in delay or on time |
|
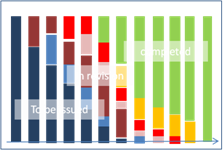
Or you can shot the picture at regular intervals to understand who is causing delays. You can even plot the summary graph for each engineering department… So finding bottle necks and risk areas. |
|
KPI: “Finalization ” |